
人工智能概论:作业 07
人工智能概论:考核
numpy 编程
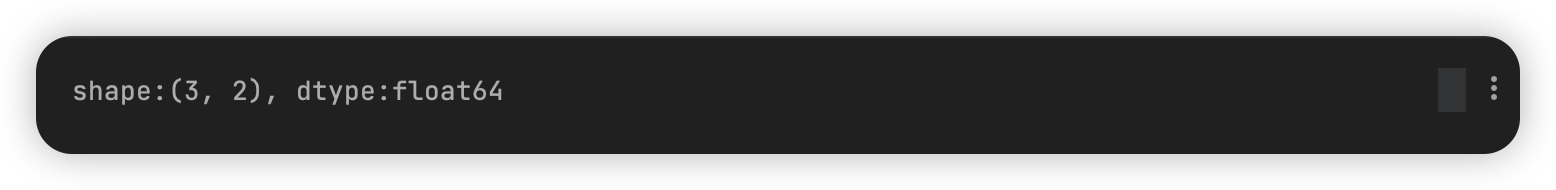
创建一个新的 3*2 浮点数数组,用 1 填充。
arr_ones = np.full((3, 2), 1.)
print("shape:{}, dtype:{}".format(arr_ones.shape, arr_ones.dtype))

创建一个新的 3*2 浮点数数组,用零填充
arr_zeros = np.full((3, 2), 0.)
print("shape:{}, dtype:{}".format(arr_zeros.shape, arr_zeros.dtype))
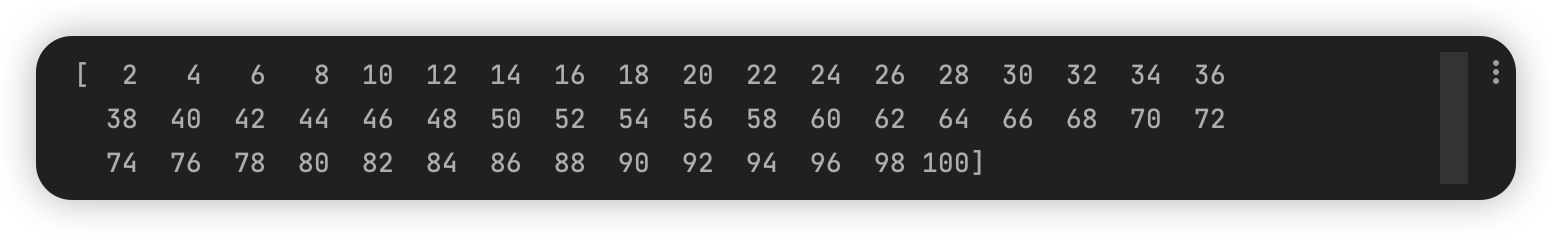
创建一个包含 2、4、6、8、...、100 的数组
arr_even = np.arange(2, 101, 2)
print(arr_even)
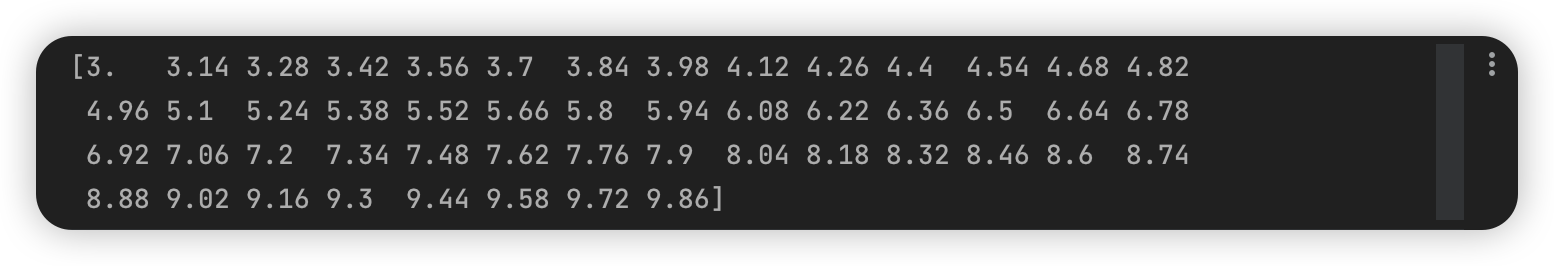
创建一个由 3. 到 10. 之间的 50 个均匀分布的元素组成的一维数组,不包含10.。
arr_ls = np.linspace(3., 10., 50, endpoint=False)
print(arr_ls)
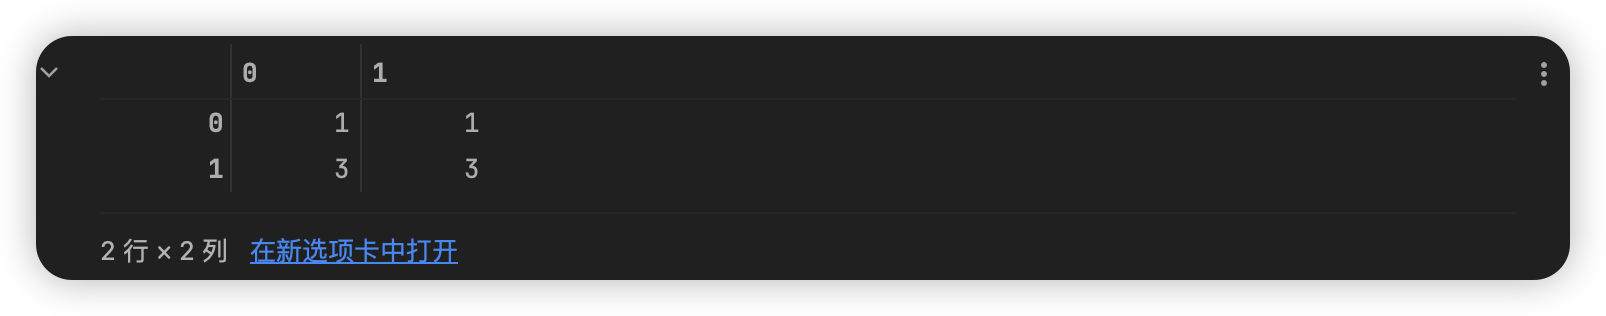
计算 x 的绝对值。x 为([[1, -1], [3, -3]])
x = np.array([[1, -1],
              [3, -3]])
x_abs = np.abs(x)
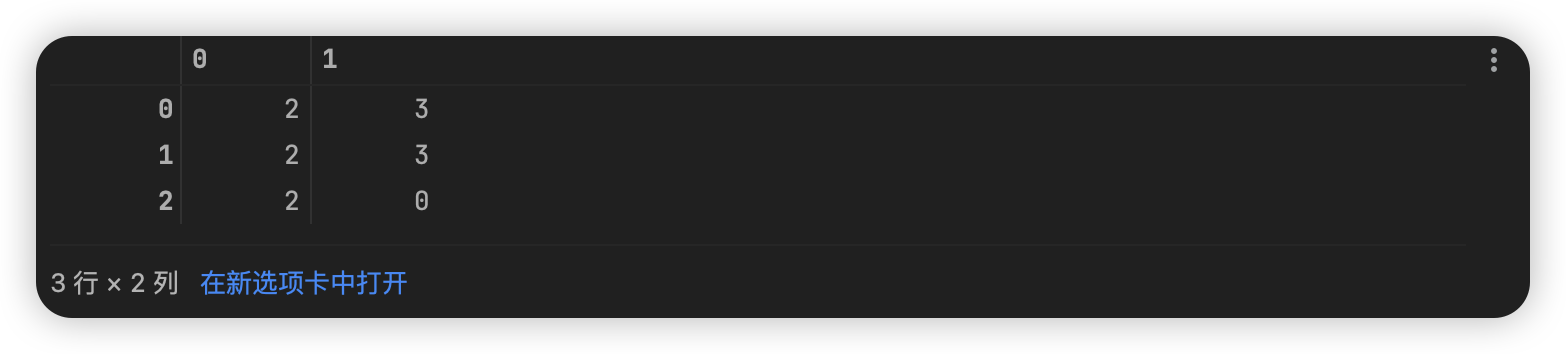
创建一个形状为 (3, 2) 的数组,并使用0 到 3(含)范围内的随机整数填充它。
arr_int = np.random.randint(low=0, high=4, size=(3, 2), dtype=int)
arr_int
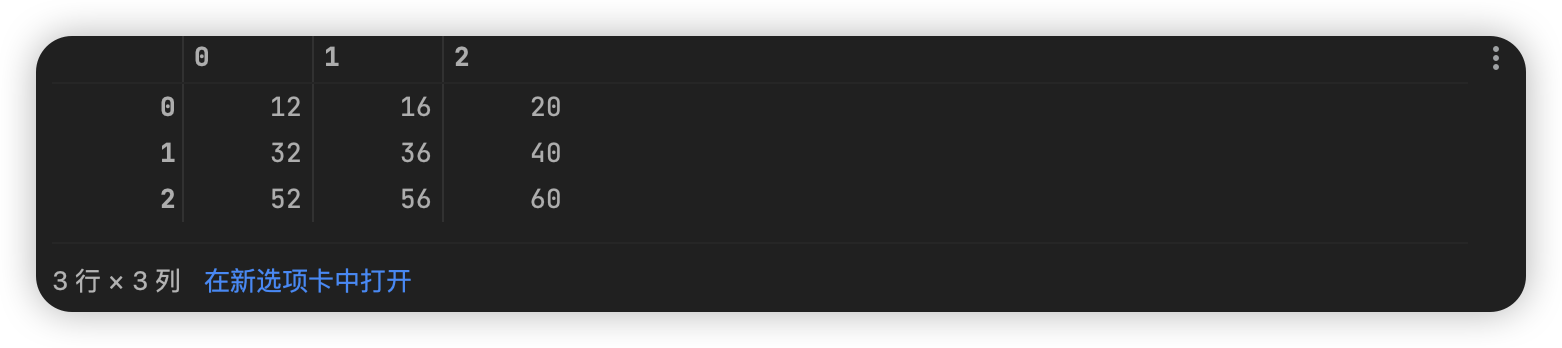
创建如下的一个矩阵,并通过切片的方式选择其中红色框框内的数据内容
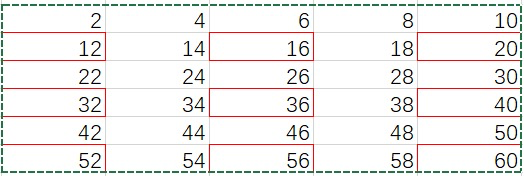
matrix = np.arange(2, 61, 2).reshape(6, -1)
matrix_section = matrix[1:6:2, 0:6:2]
matrix_section
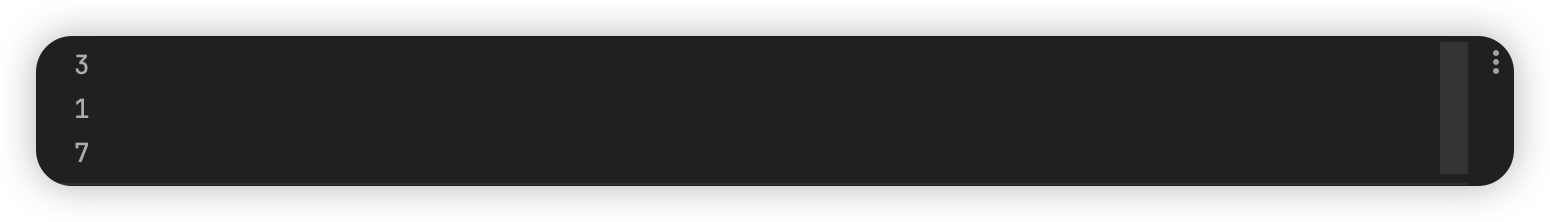
从 0 到 9 以相同的概率随机抽取 3 个不同的整数。
for i in range(3):
    print(np.random.randint(0, 10))
创建0到7的行向量,在其中第2,5,6的位置进行分割
vector_row = np.arange(0, 8).reshape(1, -1)  # shape: (1, 8)
vector_row_split = np.split(vector_row, [2, 5, 6], axis=1)
vector_row_split

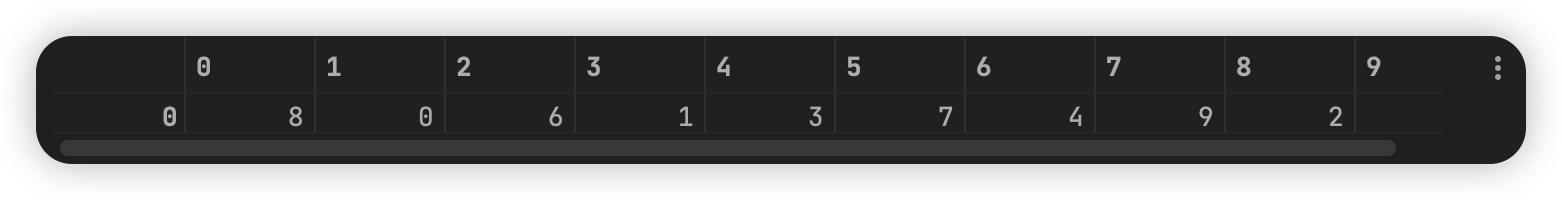
创建在0到9的行向量(包括0和9),并对数字进行随机排序。
from numpy.random import permutation

vector_row = np.arange(0, 10)
vector_row_sorted = permutation(vector_row).reshape(1, -1)
vector_row_sorted
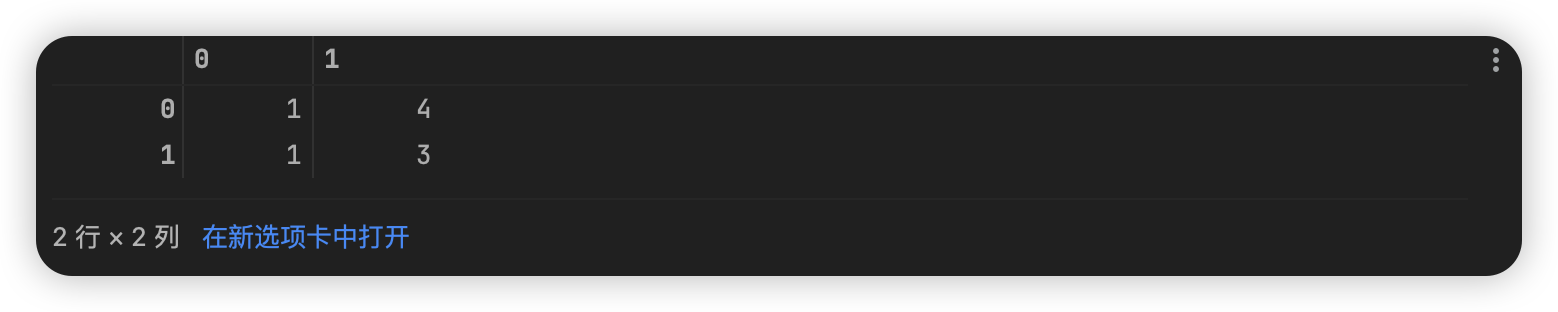
沿行对x进行排序。X为[[1,4],[3,1]]
arr = np.array([[1, 4],
                [3, 1]])
arr_sorted = np.sort(arr, axis=1)
arr_sorted
获取x中非零元素的数量。X为[[0,1,7,0,0],[3,0,0,2,19]]
arr = np.array([[0, 1, 7, 0, 0],
               [3, 0, 0, 2, 19]])
number_nonzero = np.sum(arr != 0)
number_nonzero

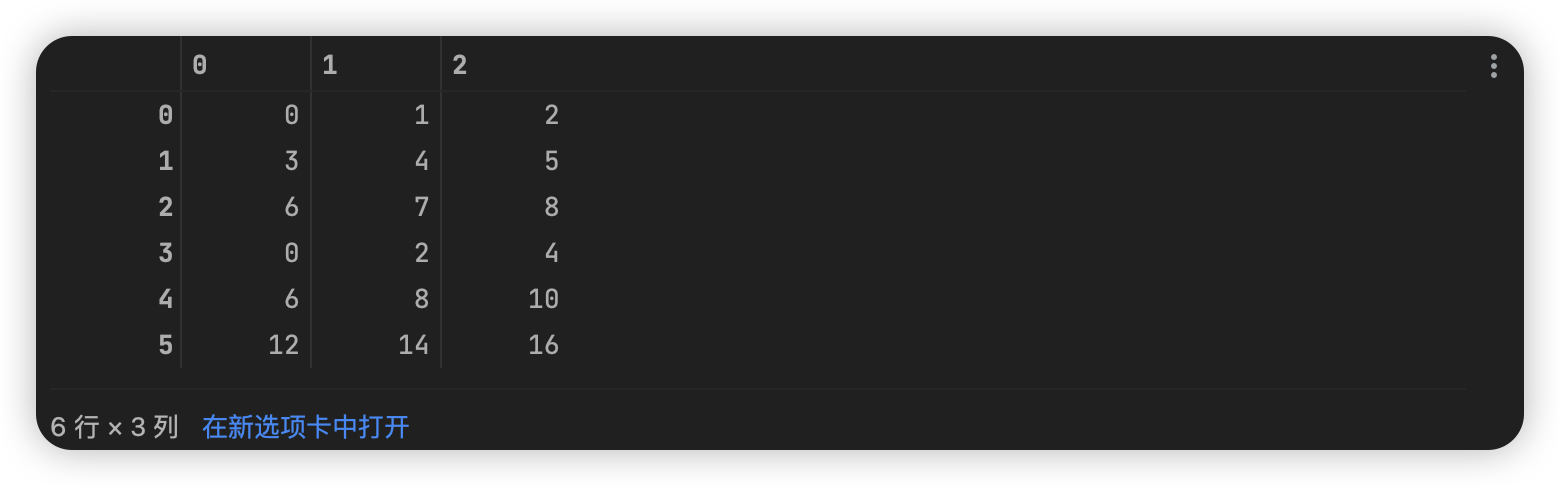
创建x为[0, 1, 2],[3, 4, 5],[6, 7, 8],y为[0, 2, 4],[6, 8, 10],[12, 14, 16],将他们进行在垂直、水平方向合并
arr_x = np.array([[0, 1, 2], [3, 4, 5], [6, 7, 8]])
arr_y = np.array([[0, 2, 4], [6, 8, 10], [12, 14, 16]])
arr_merge = np.concatenate((arr_x, arr_y), axis=0)
arr_merge
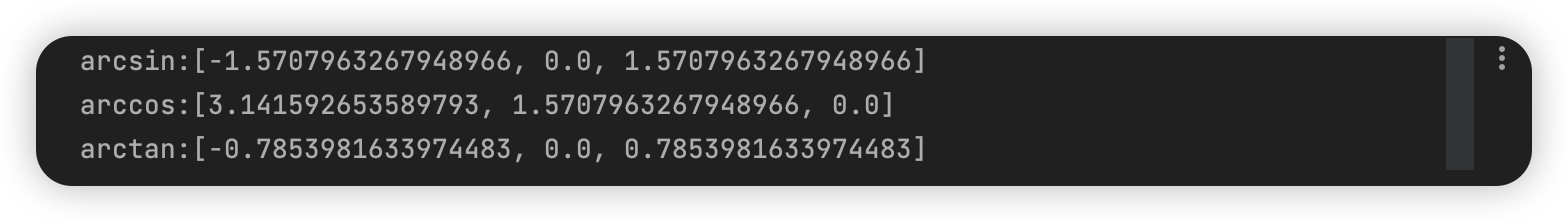
按元素计算x的反正弦、反余弦和反正切。X为([-1., 0, 1.])
arr_x = np.array([-1., 0., 1.])
arcsin_x = [np.arcsin(i) for i in arr_x]
arccos_x = [np.arccos(i) for i in arr_x]
arctan_x = [np.arctan(i) for i in arr_x]
print("arcsin:{}\narccos:{}\narctan:{}".format(arcsin_x, arccos_x, arctan_x))
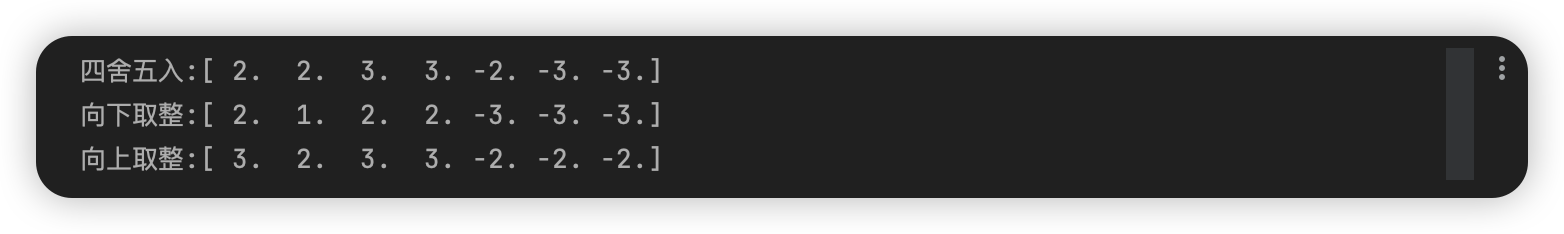
计算下列值,四舍五入x,向下取整x,向上取整x。x为([2.1, 1.5, 2.5, 2.9, -2.1, -2.5, -2.9])
from decimal import Decimal, ROUND_HALF_UP

arr_x = np.array([2.1, 1.5, 2.5, 2.9, -2.1, -2.5, -2.9])
arr_x_1 = np.array([float(Decimal(i).quantize(Decimal('0'), rounding=ROUND_HALF_UP)) for i in arr_x])
arr_x_2 = np.floor(arr_x)
arr_x_3 = np.ceil(arr_x)
print("四舍五入:{}\n向下取整:{}\n向上取整:{}".format(arr_x_1, arr_x_2, arr_x_3))
画图题
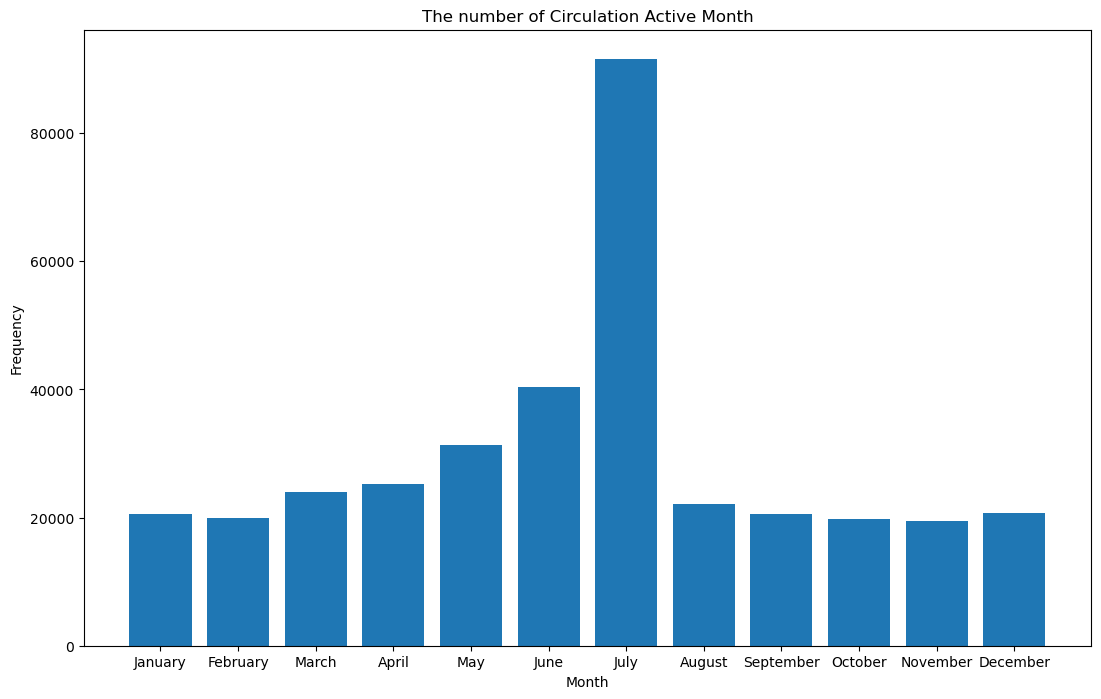
导入excel(.csv)文件内容(通过这句话导入df = pd.read_csv('Library_Usage.csv')),对其中Circulation Active Month的月份出现的次数进行统计,以月份为x轴,以月份出现的次数为y轴。
import matplotlib.pyplot as plt
import numpy as np
import pandas as pd
%matplotlib inline
df = pd.read_csv('Library_Usage.csv')
#调用月份的方法df['Circulation Active Month']
效果类似下面这张图:
import matplotlib.pyplot as plt
import numpy as np
import pandas as pd

data = pd.read_csv('data/Library_Usage.csv')

cam = data['Circulation Active Month'].to_numpy()

month_name = ['January', 'February', 'March', 'April', 'May', 'June', 'July', 'August',
              'September', 'October', 'November', 'December']
count_number = []
for i in range(len(month_name)):
    count_number.append(np.sum(cam == month_name[i]))

plt.figure(figsize=(13, 8))
plt.bar(month_name, count_number)
plt.title("The number of Circulation Active Month")
plt.xlabel('Month')
plt.ylabel('Frequency')
plt.show()
分类问题
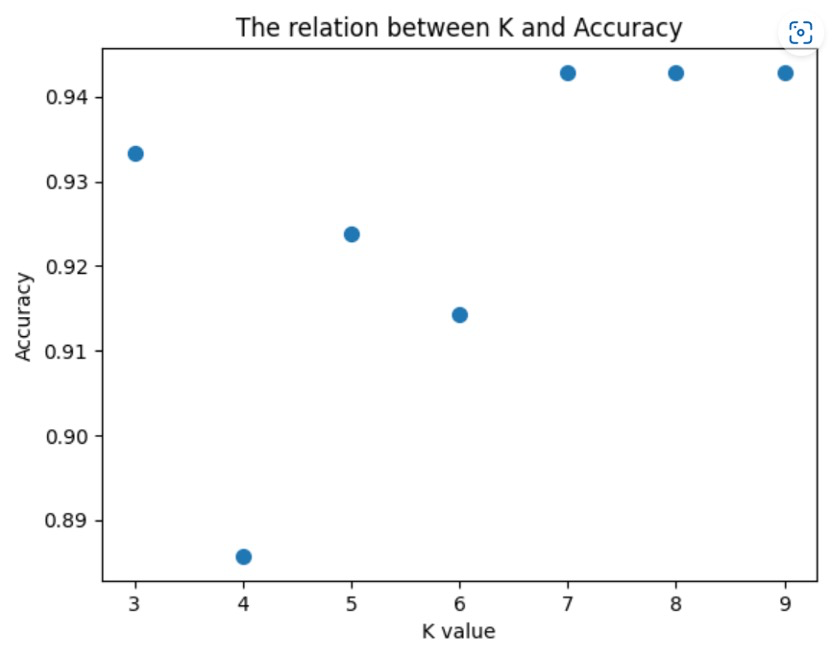
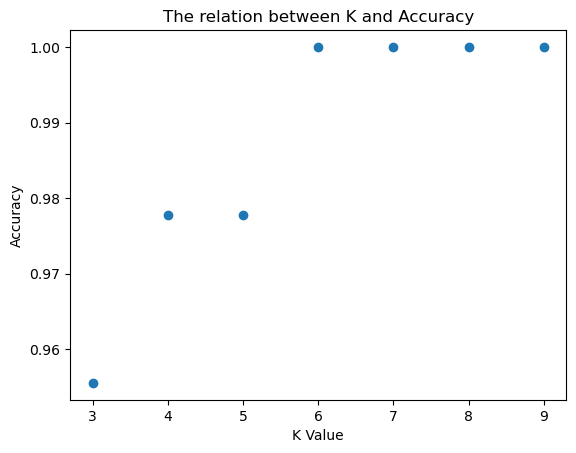
利用iris数据集,采用数据的后两列作为特征属性进行KNN分类,其中训练集占0.7,测试集占0.3。当取不同的k值时,(k= [3,4,5,6,7,8,9]),计算出测试集的准确率,并以此画出散点图,散点图的横轴为k值,纵轴为准确率,大致如下图所示。
import matplotlib.pyplot as plt
from sklearn.model_selection import train_test_split
from sklearn import datasets

data = datasets.load_iris().data
target = datasets.load_iris().target
train_data, test_data, train_target, test_target = train_test_split(data, target,
                                                                    test_size=0.3)

from sklearn.neighbors import KNeighborsClassifier

k_list = [3, 4, 5, 6, 7, 8, 9]
score_list = []

for k in k_list:
    knn = KNeighborsClassifier(n_neighbors=k)
    knn.fit(train_data, train_target)
    score_list.append(knn.score(test_data, test_target))

plt.scatter(k_list, score_list)
plt.title('The relation between K and Accuracy')
plt.xlabel('K Value')
plt.ylabel('Accuracy')
plt.show()
本文是原创文章,采用 CC BY-NC-ND 4.0 协议,完整转载请注明来自 Owen

评论
匿名评论
隐私政策
你无需删除空行,直接评论以获取最佳展示效果